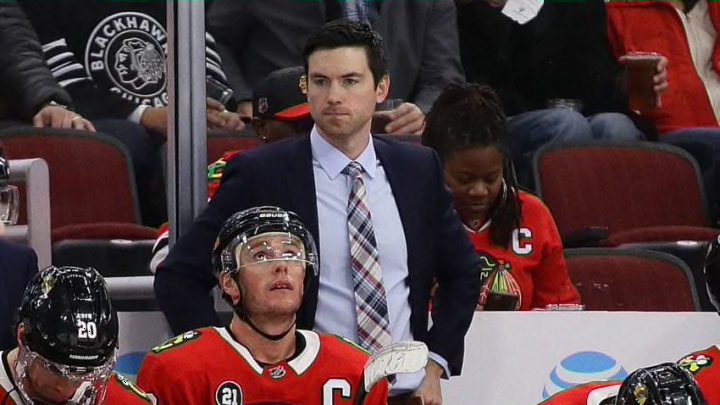
On November 6, 2018, the Chicago Blackhawks relieved Coach Joel Quenneville of his duties and named Jeremy Colliton as their new head coach, in an attempt to revitalize the team amidst a slow start to the 2018-2019 season. With 67 games under his belt now, it’s only natural to compare Colliton’s start to Q’s start.
Coach Q had become Chicago’s steadfast leader and genius architect, constructing synergistic line combinations and masterfully adapting to player matchups throughout his 3 Stanley Cup winning tenure.
Coach Q’s decisions and persona both on and off the ice seemed to contribute so much to the Blackhawks’ success that it was difficult to see this team without him at the helm.
Coach Colliton’s start was concerning at first; however, success was gradual with players beginning to learn the Colliton system and adjust to his new coaching style. The powerplay seemed rejuvenated and several players recorded career high seasons.
Unfortunately, the Blackhawks could not dig themselves out of the hole first excavated during the winter coaching change and their chances of making the playoffs waned into hopes for a successful offseason.
The question that this article attempts to address is whether or not the coaching change was beneficial to the Blackhawks. Admittedly, this question will require about 3 more years to answer, but a related question is whether Coach Colliton performed any differently in his first season (67 games) compared to when Coach Q was first given the nod in 2008.
This serves as a decent comparison for performance, given that some factors are controlled for: team, city, a core group of players, front office dynamics, etc.
Before getting to the analysis, let’s look at some basic stats for each coach for their first 67 games coaching the Chicago Blackhawks:
- Coach Q (2008-09): 37 Wins, 30 Losses, 223 Goals For, 179 Goals Against, 2255 Team Shots, 932 PIM, 66 PPG
- Coach Colliton (2018-19): 30 Wins, 37 Losses, 224 Goals For, 236 Goals Against, 2177 Team Shots, 466 PIM, 41 PPG
Coach Q performed better than Coach Colliton in Goals Against, Wins, Team Shots, and Team PPG, while performing worse in Goals For and Team PIM.
However, can we say that these differences are statistically so? One method of evaluating this question is bootstrapping. Briefly, bootstrapping is when we take all of the samples (games, in this case) and select at random with replacement as many games as we initially had samples (67 games), and compute the totals for that “season”.
We can repeat this procedure thousands of times to see the distributions of these estimates and how they change between coaches. In other words, if each coach were to coach the team thousands of times then what would be the results on average? The curious reader is encouraged to visit here to learn more about bootstrapping.
Therefore, I performed bootstrapping to evaluate whether these differences are statistically reliable between Coach Q and Colliton in their first 67 games coaching the Blackhawks. 67 games were used because that is the number of games that Colliton has coached for the Blackhawks thus far.
The analysis that follows was performed on data retrieved from Hockey Reference and all R code is available on my Github account (for my other Blackhawk Up R analyses see here and here).
Bootstrap Results
After bootstrapping their metrics 2,000 times we can see that several of their measures overlap, while some of them show separation in their distributions.
In my upcoming @Blackhawk_Up article I analyzed differences in performance between Joel Quenneville vs. Jeremy Colliton in their first 67 games as coaches for the #Blackhawks #HockeyTwitter #NHL
— Matt Kmiecik (@mattkmiecik14) May 13, 2019
Using bootstrapping, we can see that they differ in GA, PIM, and PPG (1/n) pic.twitter.com/gw2jCDfkLu
When reading this graph, separation in the distribution means that Coach Q and Colliton performed differently on that measure, while overlap suggests that there is no real difference. Therefore, we can see differences in Goals Against, PIM, and PPG, while significant overlap is seen in several other measures.
Confidence Intervals
To see whether these separations are statistically significant, we can compare their 95% confidence intervals. Briefly, a confidence interval indicates an upper and lower estimate in which we can be confident, to a certain specified level, that the true value lies within that interval. Here I’ll be using 95% confidence intervals.
Upon examining their 95% confidence intervals, we can see that their PIM and Goals Against are reliably different with a trending difference in PPG. Coach Q and Colliton are well matched across a variety of other measures, suggesting similarity in their first 67 games (2/n) pic.twitter.com/VCBLWPEoOV
— Matt Kmiecik (@mattkmiecik14) May 13, 2019
Again, we can interpret this plot similar to the one above: if the tails of the intervals do not touch then we can say that the coaches performed differently on the specified metric.
As we can see, there is clear separation on PIM and a likely separation on Goals Against and PPG. The remainder of the estimates overlap, suggesting no differences between Coach Q versus Colliton.
Bottom Line
During their first 67 games with the Blackhawks, Coach Q and Colliton performed differently on PIM and Goals Against. Coach Q had significantly more PIM, while less Goals Against than Coach Colliton. Coach Q also had much more PPG, but this difference trended towards significance. Remarkably, their Wins, Losses, Shots, and Goals For were not different.
Although Coach Colliton demonstrated a much weaker defense than Coach Q, his team stayed out of the penalty box and performed very similar in several areas, including Goals For, Shots, Wins, and Losses. These results suggest that, despite Coach Colliton’s poorer performing defence, he measured up to Coach Q quite well in his first 67 games.
Nevertheless, Coach Colliton and his Blackhawks have some serious offseason work to do in cleaning up their defense and we are excited for their 2019-2020 return.
